


Windows GUI
It is a native Windows application that communicates with the core server using the PRTG API. All features for day-to-day use are implemented in the Windows GUI (for some features the web interface is shown).
The Windows GUI is automatically installed on the computer where you have installed your PRTG Core Server. To use the Windows GUI on other computers, simply download and install the software from PRTG's web interface (select menu item "Setup | Downloads"). It can be installed on all Windows versions "XP or later".
The Windows GUI runs in two modes:
- Graphical user interface for PRTG: You can add/edit groups, servers, devices and sensors (includes viewing sensor data and graphs as well as comparing sensor data). You can review and configure alarms, maps and reports.
- Tray tool: runs on your PC in the background and will notify you with popups, sounds etc. whenever PRTG discovers changes in your network.
The Windows GUI shares many concepts with the web interface and also opens a browser window for some features. For new PRTG users it is recommended to start with the web interface before using the Windows GUI.
Working with the Graphical User Interface
When you start the Windows GUI for the first time it will ask for "Server IP/DNS name" and your credentials:
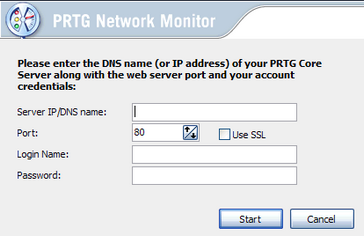
As soon as you click on "Start" it will contact the PRTG Core Server and the main window will show up:
At the top of the window you can find the summarized status for all sensors, a button to manually refresh the monitoring data and a search box:
![]()
Using tabs the Windows GUI offers the same main module selection as the web interface:
![]()
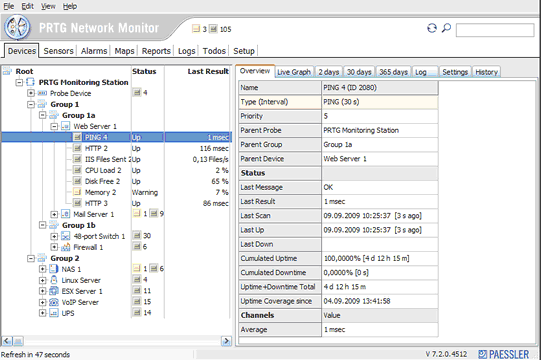
Module "Devices"
In the "Devices" module you will find a tree-like view of the groups, devices and sensors on the left side. You can select one or more items from the list (using CTRL and SHIFT while clicking with your mouse) and you will see detailed information about the selected items on the right side. Using a second row of tabs you can select what information you want to display:
![]()
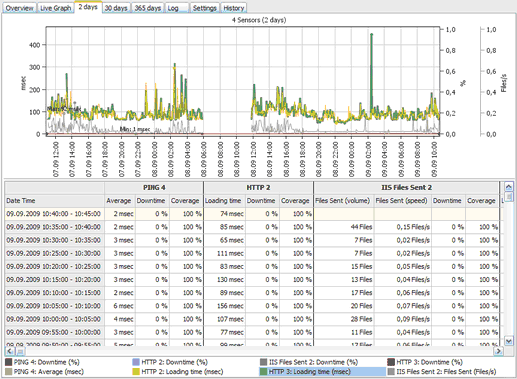
The following screenshot shows the graph and data table for 3 sensors. In this sample the green line in the graph is shown thicker by hovering the mouse cursor over the respective entry in the legend at the bottom.
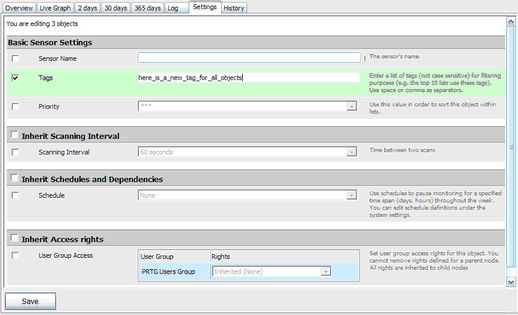
If you select the "Settings" tab you will see edit fields only for those object settings that are shared by all selected objects (e.g. the interval is shared by all sensors, tags are shared by all objects). Select the leftmost checkbox for the settings you want to edit for all objects (they will be shown with a green background), enter the desired value(s) and click "Save".
Other Modules
The usage of other modules is straight forward. Lists show the sensors, alarms, maps, reports, logs and ToDos.
You can navigate these lists as usual for a Windows application:
- Review the information by scrolling the content
- Resort the lists by clicking a column header
- Resize the columns by dragging column separators
- Edit the list items using their context menus (shown upon right click)
The Sensors and Alarms module also offer controls to filter the lists.
Working With the Tray Tool Functionality
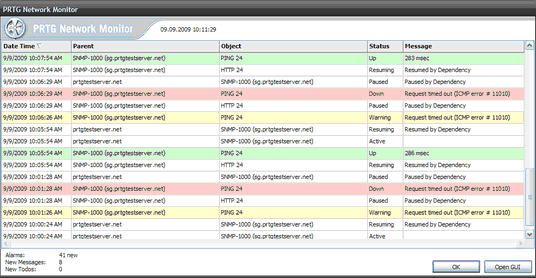
When you close the Windows GUI main window you will still see a PRTG icon in the Windows System Tray in the lower right corner of your screen. The Tray Tool will now contact your Core server every 60 seconds and it will alert you in various ways when new events occur, sensors go down etc. (depending on your settings). For example, a popup showing the latest events looks like this:
Configuring the Windows GUI
Select "File | Options & Server Settings..." to edit the settings for the Windows GUI:
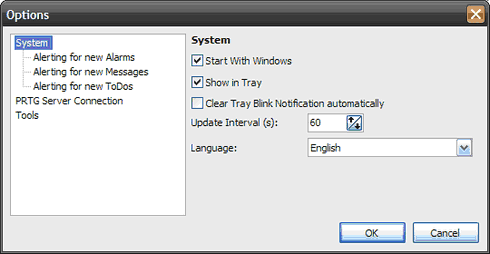
Here you can set various alerting options, enter one or more PRTG server connections and you can configure command line tools.
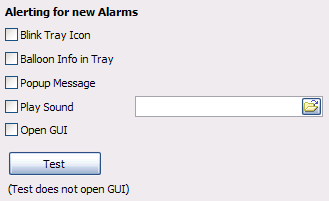
The following settings are available for alerting (you can test the current settings by clicking "Test"):
- Blink the icon in the Windows system tray
- Show a balloon popup near the system tray
- Show a popup window
- Play a soundfile
- Open the main GUI window
Keywords: tray,system tray,user interface,Windows