


PRTG Probe Administrator
The PRTG Probe Administrator can be started from the "START | PRTG Network Monitor" program group and allows to configure a probe running on the local PC. This can be the "Local Probe" for a PC running a full PRTG installation, or one of the remote probes when only the probe installer was used on a PC. The PRTG Probe Administrator is divided into four tabs:
Probe Control
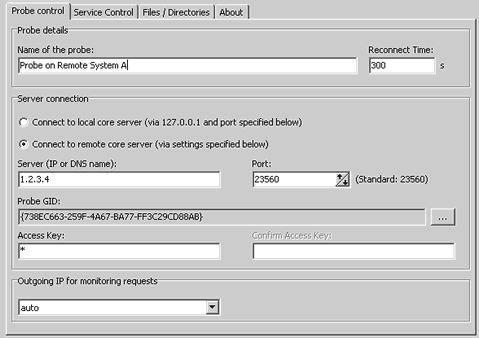
Under the Probe Control tab you can define
- Name of the probe (the name will be shown in the web interface).
- Server Connection: the server's IP or DNS name, as well as the server's port and the probe's access key (these settings must match the settings in the Core Admin Tool, see Multiple Probes and Remote Probes).
- Probe's GID, the unique identifier for each probe (use with extreme caution!).
- Reconnect time (in seconds) which is the time between two connection attempts when the core can't be reached.
- Outgoing IP for monitoring requests: Choose the IP address that all outgoing monitoring requests should use. The setting "auto" is recommended (e.g. it automatically chooses the right IP on multi-homed systems).
Service Control
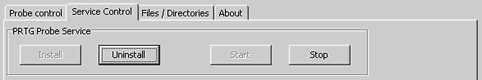
Under the Service Control tab you can install/uninstall, as well as start/stop the probe service.
Files / Directories
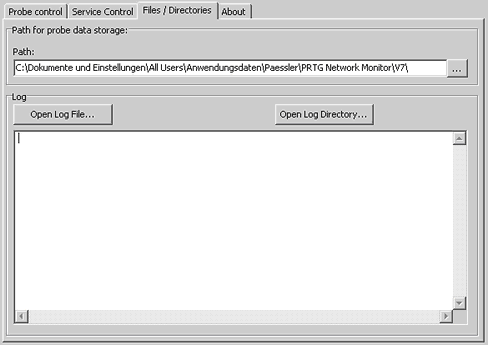
Under the Files/Directories tab you can select a path specifying where probe data is to be stored. You can further open the probe log files and the probe's log file directory.
Keywords: IP,port,Probe,Probe Server Admin Tool,probe,probe connection,IP,port,access key,probe access key,folders,data folders,service control,log,local IP